Moodle Analytics and Reporting: what you should be measuring to improve student success.
If you’re an education provider and your learners’ success is one of your key goals, we don’t need to tell you that you cannot do without quality data practices. Getting the right data, making sense of it and acting upon it is key to the continuous improvement of your practices and your students’ success.
Whether you’re already using or considering Moodle as your LMS, you’ll be glad to know that in Moodle, there are several ways to track student progress and achievements. Below, we offer an overview of what you should be measuring, some of the tools available to do that, and what actions you should be taking once you have your data.
We must note that some of our clients prefer to combine their in-built LMS analytics with custom developed tools, specifically designed to their organisation’s needs. This practice takes your student success insight to the next level and is something we definitely recommend looking into should your budgets allow. But let’s start with the basics:
The two key analytics areas for student success:
When it comes to measuring student success in Moodle, the two key areas you should be looking at are student engagement (ongoing progress) and assessment results. The two in isolation will never provide you with a good insight. To identify patterns and areas for improvement, you must look at both together.
1. Student engagement / progress / retention:
Watch: Are students engaging / dropping out?
Act on it: Identify and contact them. Ask them why.
Watch: How effective are the interventions with students in retaining them and increasing their outcomes?
Act on it: Statistically analyse students outcomes over time; log interventions with students; plot interventions and results by date; and graph trend lines to identify correlations.
Watch: At a high-level, are our students over-assessed, or overburdened by concurrent assessments across subjects and disciplines?
Act on it: Visualise and drill down to see when concurrent assessments are scheduled, and contact/recommend academics adjust dates
Watch: Dig into some details. For example, do students spend more time on a particular course section as opposed to other (in your view similar) sections?
Act on it: Ask why? Can the content in that section be improved to make it easier to navigate? Compare results on before and after the content adjustment. Did the change affect assessment / quiz results on that section topic too?
Available tools*:
– Moodle Learning Analytics plugin a privacy-friendly Learning Analytics solution for Moodle. The plugins integrate into Moodle courses and offer statistics to teachers and students.
– Assessment frequency core plugin for Moodle (use for overall assessment planning)
– Level Up! XP Gamification plugin – encourages student engagement by awarding experience points, levels, and badges for completing activities and achieving milestones. It provides a visual representation of student progress and can motivate learners to actively participate and complete course activities.
– Questionnaire Moodle plugin – use it for student surveys to measure their satisfaction, engagement or other aspects of their overall learning experience.
– Course dedication plugin – provides visual representation of dedication levels to a course
– BigBlueButton – a video conferencing / virtual classroom plugin integrated with Moodle. It offers engagement indicators such as attendance and active chat interactions, allowing you to assess student engagement during live lessons.
*Learn more here and remember to evaluate and test each plugin before implementation to ensure compatibility with your Moodle version and suitability for your specific engagement measurement needs. Don’t forget to consider student privacy and obtain appropriate consent when collecting and analysing engagement data.
One of our clients have developed a custom solution in which the engagement activity data links to their CRM and communication tools are collated for student advisors so they are able to exchange information quickly and contact low engagement students efficiently, helping them get up to speed before it’s too late.
2. Academic quality assessment:
Combining your academic assessments data with detailed student activity / progress / engagement data (as outlined above) is key. For example, you may find trends between average engagement time and final test results; or, between specific activities engaged in (e.g. certain reading material provided) and final test results.
Watch: Was any teaching content linked to higher outcomes?
Act on it: Link student access to content to final student outcomes.
Watch: How are students responding to assessment questions and what does it tell us? Are our formative and summative assessments of the highest possible quality?
Act on it: Analyse quiz statistics and review questions highlighted as potential anomalies.
Available tools*:
– Moodle Quiz statistics report
– Moodle Competencies and Learning Outcomes feature – helps you define specific learning objectives, align them to assignments and track student progress towards their key objectives.
– Moodle Workshop Activity – a powerful tool for self assessment and peer evaluation. Students add submissions which are then distributed amongst their peers for assessment based on a grading scale specified by the teacher.
*Learn more here and and remember to evaluate and test each plugin before implementation to ensure compatibility with your Moodle version and suitability for your specific engagement measurement needs. Don’t forget to consider student privacy and obtain appropriate consent when collecting and analysing engagement data.
Making sense of your data.
Always start with your key objectives in mind. This will determine what questions you want your data to address and therefore, what kind of data exactly you may (or not necessarily) need to collect.
Do not assess anything in isolation. Information such as course completion rates, participation levels, time spent on various activities and even things like engagement levels in student forums usually relate to student assessment results.
Avoid assumptions based on numbers alone. Various data should be evaluated against each other for best / well-informed decision making and continuous improvement in your teaching and learning processes.
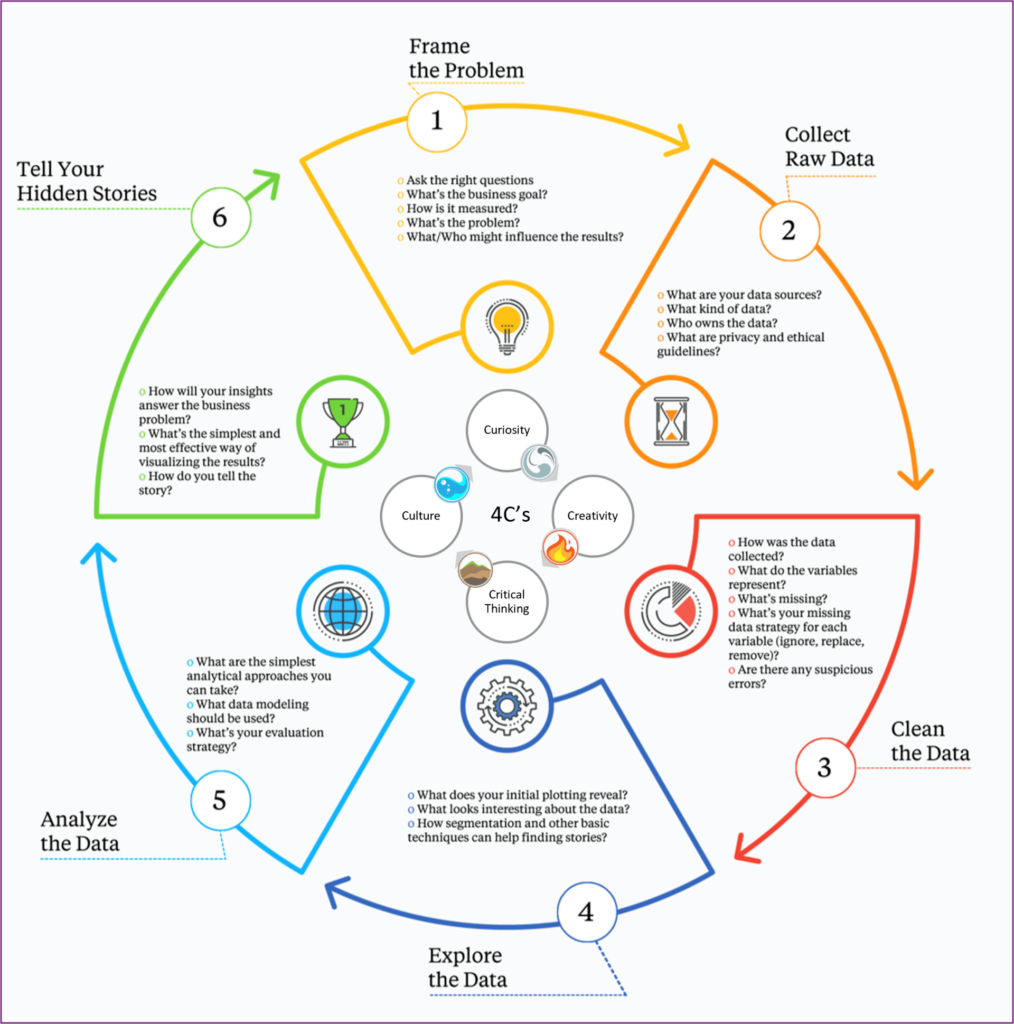
Use both quantitative and qualitative analysis for a more complete picture and embrace data visualisation tools to help you see patterns and hidden stories – incorporate those in your strategic planning.

The insight you gather will help you ask the right questions in your strategic planning sessions as well as facilitate better (data-driven) decision making.
Involving various stakeholders in designing your analytics processes (or custom tools), and in interpreting the data is always a great strategy. In addition to educators and your student success team, include instructional designers, Moodle administrators and ideally, students themselves.
Read: Digital and Culture Shifts: The What and Who of Your Organisation’s Transformation.
Make use of predictive analytics. By analysing historical data and identifying patters, you can predict which students may require additional assistance or are likely to excel. Allocate resources accordingly and provide targeted support where you can / where its most needed.
Important!
When working on analysing your learners success, always adhere to privacy and data protection regulations.
Further reading:
Completing the Loop: Returning meaningful analytics data to teachers (The University of Melbourne)
Getting Access to Your Data in Moodle by Alex Lawn
7 best Moodle Reporting Plugins for Learning Analytics (edwiser.org)
Data Literacy for Learning (elearningindustry.com)
