It’s time to come clean, and to be honest about yet another love affair that I’ve formed with an open source software toolset. Metabase, how I love you so.
You haven’t met Metabase yet? I’m actually a little bit jealous. Be ready to be amazed.
What is Metabase?
In short, it’s an open source business intelligence tool. Some would probably describe it as a reporting and dashboard tool. Metabase allows you to easily ask questions of your data and view it in a number of sensible formats that make sense.
Metabase is absolutely not a spreadsheet. But if you are used to pulling data out of various sources, building pivot tables in a spreadsheet and spitting out a plethora of line, bar and pie charts, Metabase is for you. But this is quite a primitive and limiting view of what can be done with Metabase.
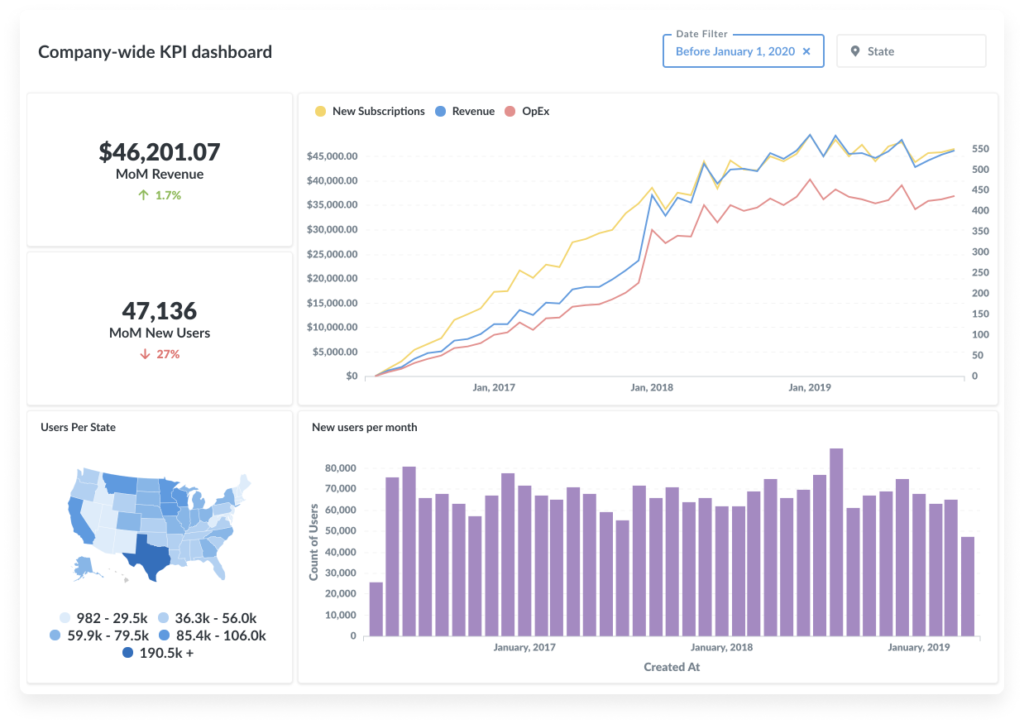
Another way simpler way of conceptualising Metabase is as a dashboard engine. Make pretty dashboards for us all to see – full of your very own meaningful data.
Like all great software, Metabase is released under an open source licence (AGPL). This means you can take it, run it, analyse it and even extend it. There is also an Enterprise version that has some extra features that corporate organisations may likely need.
What makes a good dashboard/BI tool?
Another dashboard, really? We see you rolling you eyes. Surely we already have too many places to show us the state of play with our business. A graph here, a pie chart there.
Yes, we’ve all suffered from YAS (Yet Another System) fatigue over the years. And at Catalyst we are no exception.
The trick is balancing the prevention of system sprawl with being able to find a new tool that will meaningfully improve your ability to work. It’s a tightrope!
Catalyst believe that the most important quality of any dashboard tool is that — assuming you have access to the necessary data — you can go from “question” to “visualistion” with nothing more than a bit of SQL and some elbow grease. No team of software developers is required to get a bar chart and some tables of links.
Once you have the first output — a dashboard or graph — we review and tinker. Then a new question will pop into our head based on what you see.
“Interesting, so I can see that on Wednesday we are running out of eggs, can we compare this with the number of omelets served for breakfast per day?”
If you work through these question iterations quickly (meaning hours), you can enable the right people to explore your data. And get to the holy grail of actionable information – the crowd cheers. All done without a single line of web application code (perhaps some SQL or other querying markup).
So, what can we use it for?
Good question, ever had the need to throw together some interfaces (a graph or two) for a data set that resides in one your applications. If required, you might pull some data out, put it into excel, pivot table it and you’re done. Yet another spreadsheet attached to an email …
This is the sweet spot for an entry into metabase. Set up an instance of Metabase and point it at your database (application data source) with a read-only user (this is where some technical skills may be required.) Now it’s time to roll your sleeves up and see what you can find.
What have we used Metabase for?
Thanks for asking. We started with some operational reports base on our timesheeting and project management data sources. Questions like:
- How many hours have we worked this week for Client X? Who? Which cards?
- Which support tickets have we spent the most time on over the last 3 days?
And we’ve done some even cooler things with reporting on our Enterprise Moodle LMS instances. Things like:
- For exam BIOL 101, show me a real-time dashboard of all the students who have started, not started, completed.
- In exam MATH 101, show a graph of the start time of the students in the exam window.
- In exam PHYS 101, please build a table with all the start and finish metrics for the exam, as well as embedded links to the Moodle log for this student.
Even this morning, I added two new graphs to a dashboard with a “I wonder what this will look like?” mindset. So powerful!
And yes, you likely need some ETL
In the real world in order to make the most of a reporting and BI tool, you likely need some sort of Extract, Transfer, Load (ETL) process to get application source data into a state that is the most useful for your reporting needs.
Catalyst is using Pygrametl – and there are an ocean of other options. This topic is bigger than we have time for in this post.
But remember, when looking for tools to experiment with, start with Open Source!